


Chartist - Technical Analysis
Chartist - Technical Analysis의 설명
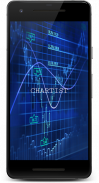
If a picture is worth a thousand words, then a chart can include more than a million data points. And hence is much more useful to convey technical analysis and your thoughts. Chartist is a simple application for people interested in following indian markets that allows you to check and see chart patterns being formed on daily and weekly basis.
Major Exchanges -
1. National Stock Exchange (NSE)
2. Bombay Stock Exchange (BSE)
You must have a little bit of background on technical analysis. Or you may prefer to learn on the way. Once you get a feel, you will start seeing a pattern being formed. Please use the drawings to mark those patterns and save the charts for your future reference and also for others to see. At the same time you can view other's analysis and chart patterns of leading stocks and indexes, and mark them your favourite.
HOW IT WORKS?
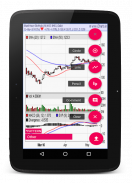
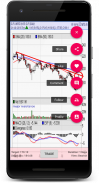
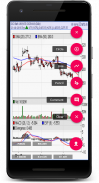
1. You can view charts of more than 6000+ STOCKS and INDEXES.
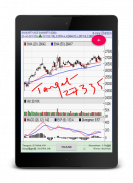
2. You can draw on the charts with free hand and save it for future reference.
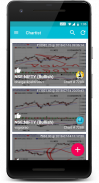
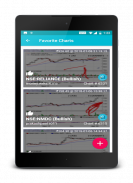
3. You can learn from others doing the same and save their technical analysis as your favorites.
TECHNICAL CHART PATTERNS INCLUDED
The following is an exhaustive list of basic chart patterns that the application supports at the moment -
Reversal - Double Top,Reversal - Double Bottom,Reversal - Head and Shoulders Top,Reversal - Head and Shoulders Bottom,Reversal - Falling Wedge,Reversal - Rising Wedge,Reversal - Rounding Bottom,Reversal - Triple Top,Reversal - Triple Bottom,Reversal - Bump and Run,Continuation - Flag, Pennant,Continuation - Symmetrical Triangle,Continuation - Ascending Triangle,Continuation - Descending Triangle,Continuation - Rectangle,Continuation - Price Channel,Continuation - Measured Move ~Bullish,Continuation - Measured Move ~Bearish,Continuation - Cup with Handle
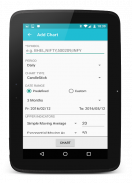
CHART TYPES
1. Candlestick
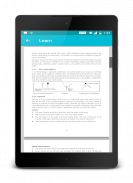
2. Lines
3. OHLC
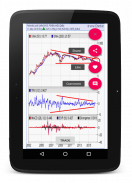
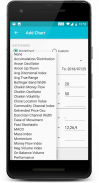
TECHNICAL INDICATORS SUPPORTED
UPPER INDICATORS
Simple Moving Average,Exponential Moving Average,Weighted Moving Average,Triangular Moving Average,Bollinger Bands,Donchian Channel,Envelop (SMA 20 +/- 10%),Parabolic Sar
LOWER INDICATORS
Accumulation/Distribution,Aroon Oscillator,Aroon Up/Down,Avg Directional Index,Avg True Range,Bollinger Band Width,Chaikin Money Flow,Chaikin, Oscillator,Chaikin Volatility,Close Location Value,Commodity Channel Index,Detrended Price Osc,Donchian Channel Width,Ease of Movement,Fast Stochastic,MACD,Mass Index,Momentum,Money Flow Index,Neg Volume Index,On Balance Volume,Performance,% Price Oscillator,% Volume Oscillator,Pos Volume Index,Price,Volume Trend,Rate of Change,RSI,Slow Stochastic,StochRSI,TRIX,Ultimate Oscillator,Volume,William's %R
Although, this is a pretty exhaustive list, we intend to support more and more chart patterns and technical tools in future. Feel free to suggest and we will be quick to incorporate.
Chartist connects to Kite - Zerodha's trading platform.
DISCLAIMER: Users of Chartist are supposed to be beginners in finding chart patterns following technical analysis. Their analysis and opinion conveyed are personal. This must not be used for recommendations. Also, we cannot be held responsible for any resulting loss from inaccuracies or via any other means. All information provided via Chartist must be used for information purpose only and not as investment/financial/research advice.
WE CONNECT YOU TO THE WORLD OF TECHNICAL ANALYSIS! DO CARE TO CONNECT WITH US?
Facebook: https://facebook.com/speculometer
Twitter: http://twitter.com/speculometer
eMail: speculometer@gmail.com
Website: http://www.speculometer.com
SPECULOMETER :-)
Chartist - Technical Analysis - 버전 93.0.0
(28-04-2020)Chartist - Technical Analysis - APK 정보
APK 버전: 93.0.0패키지: com.speculometer.chartsChartist - Technical Analysis의 최신 버전


동일 카테고리의 앱


